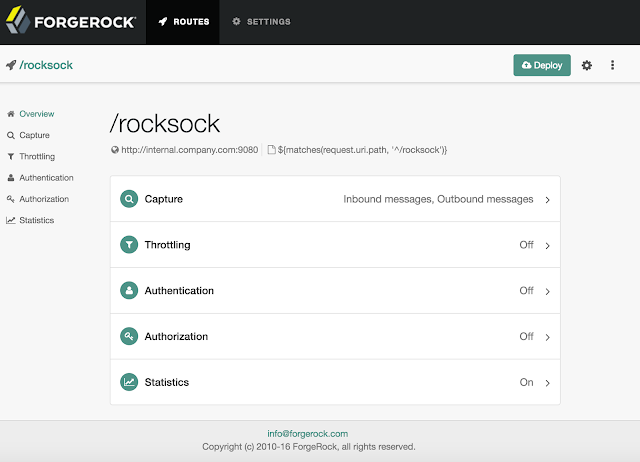
IG Studio allows to easily enable statistics collection. Data is cumulative since server startup or over recent time intervals. Statistics-based health checking is not just if endpoints are alive or dead, but how they are serving clients.
So, bring up IG Studio and configure the /rocksock application (route) and enable statistics for it.

"monitor" : {
"enabled" : true,
"percentiles" : [ 0.25, 0.5, 0.9, 0.99, 0.999, 0.9999 ]
}
The cumulative statistics can be retrieved with a simple curl command :
curl http://openig.example.com:8080/openig/api/system/objects/_router/routes/rocksock/monitoring?_prettyPrint=true
{
"requests" : {
"total" : 1590742,
"active" : 0
},
"responses" : {
"total" : 1590742,
"info" : 0,
"success" : 1590742,
"redirect" : 0,
"clientError" : 0,
"serverError" : 0,
"other" : 0,
"errors" : 0,
"null" : 0
},
"throughput" : {
"mean" : 3060.6,
"lastMinute" : 3206.0,
"last5Minutes" : 2584.7,
"last15Minutes" : 1349.9
},
"responseTime" : {
"mean" : 0.017,
"median" : 0.009,
"standardDeviation" : 0.042,
"total" : 31727,
"percentiles" : {
"0.25" : 0.007,
"0.5" : 0.009,
"0.9" : 0.022,
"0.99" : 0.206,
"0.999" : 0.504,
"0.9999" : 0.995
}
}
}
The allows allows to read out characteristics which help to determine the actual health of the system:
- IG is up and this application protection (route) is deployed
- IG treated 1590742 requests since startup for /rocksock of which all received a success response
- The throughput over that last minute was 3206 requests per second, 2584 requests/sec over the last 5 minutes and 1349.9 requests over the last 15 minutes
- 99.99 % of the requests were responded to in 0.995 milliseconds or less
The Identity Gateway Studio will be shipped with ForgeRock Identity Gateway 5.0.
For more, see the Identity Gateway Studio introduction or the blog post on message capture.


